


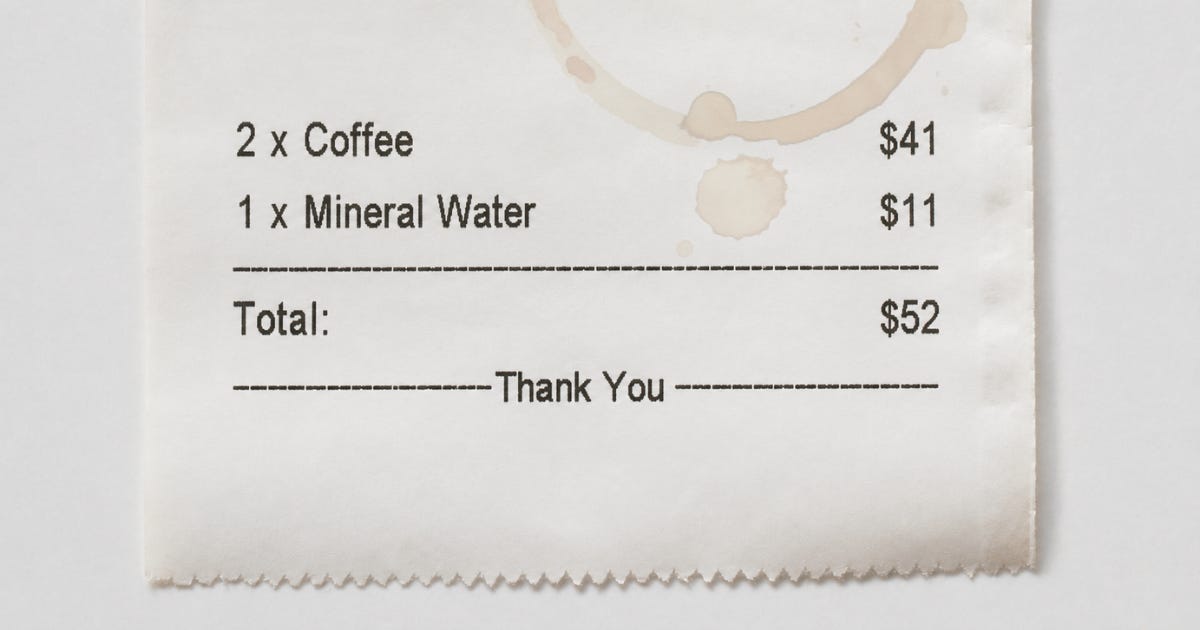
$52 for two coffees and a bottled water at LAX. A cheesesteak for thirty-five a few days later in Philadelphia. Vegas was no better.
I am aware that airports are their own economy, and that a handful of concessionaires hold monopoly leases, selling to people who cannot walk down the block to a competitor. I know that, and on its own it does not prove much about inflation.
But it is what first sent me looking. The discrepancy between what I read in the news and what I am feeling in everyday life was not making sense to me. I wanted to know whether the feeling pointed to something real, or whether I was reading too much into a run of expensive airports.
Two numbers, one word
Officially, US consumer prices rose about 3.4% through July 2026, down sharply from the 9.1% peak of June 2022, itself the highest reading since 1981. Compare today with where things stood in January 2021, and the price level – meaning what the basket costs in dollars rather than how fast that cost is rising – is nearly 27% higher. The headline number only tells you how fast prices are rising now, not how far they have already traveled over recent years.
It took me a while to separate the two. Inflation is the speed. The price level is the distance. Or put another way, inflation is the speedometer. The price level is the odometer. When inflation falls from 9% to 3%, the car has slowed down. It has not reversed, and the odometer does not run backward.
Some categories have moved much further than the average. Since January 2021, ground coffee has roughly doubled; ground beef is up 74%, and gasoline is up 67%. These are single items rather than the index, and they moved further than most things did. They are also what was in my hand at that airport, and in most of the receipts since then.
The whole decade before the pandemic averaged about 1.8% inflation. Today, we treat 3.4% as a win, nearly double what we used to call normal.
Accumulation
Each year gets reported on its own, and each one sounds like progress. About 5% in 2021, 8% in 2022, 4% in 2023, then roughly 3% in the years since. Told that way, it is a problem being addressed. Told the other way, it is a bill that keeps growing. A basket that cost $100 in January 2021 costs about $127 today – but is that even the same basket?
Nothing gives it back. The only thing that brings the price level itself back down is deflation: prices actually falling, or currency devaluation. Lower inflation simply means they rise more slowly, which sounds appealing until you realize it is the outcome central banks work hardest to prevent, because when people expect things to be cheaper next month, they stop buying them this month.
Which means the 2% everyone treats as the definition of stability is a target for the rate, not the level. It is a commitment to prices rising forever, gently enough that we stop noticing. At 2% a year, they double every thirty-five years. By design.
Substitution – are we even looking at the same basket?
The deeper I went, the stranger it looked. The official figure is not measuring the price of buying the same things you bought before. Since 1999, most of the CPI has been calculated with a formula that allows for a modest amount of consumer substitution. As one item’s price jumps, the methodology assumes shoppers partly shift to a cheaper alternative, which smooths out the felt pain of any single spike.
In practice, that means if beef gets expensive and you buy chicken, the index partly records the chicken. You ate. You just did not eat what you wanted, yet the statistic treats that as broadly the same outcome.
There is a real logic to it: the index is trying to measure what it costs to maintain a standard of living, not what it costs to buy an identical basket twice. But “standard of living” is doing enormous work in that sentence. It is the difference between the cost of keeping going and the cost of keeping what you had, and most of us are trying, at least, to live in the second one.
The same move shows up in the biggest expense most people have. CPI does not use house prices or mortgage payments to measure the cost of owning a home. It uses an estimate of the rental value of that home instead. Economically coherent, and nothing like the number facing someone trying to buy.
None of these choices is a conspiracy. Each is defensible on its own terms. What struck me is that they all lean the same way. Each one smooths things out to a substituted life at a higher cost.
The house
Take the biggest purchase most people ever make. No cheaper version of a house counts as the same thing, and no average softens it.
In 1985, the median American home sold for $82,800 against a median household income of $23,620, about three and a half times what a family earned in a year. Today the median home sells for roughly $409,000, against a median household income of about $84,000. Close to five times.
Incomes went up about three and a half times over those four decades. Houses went up nearly five. You could buy a smaller house, move somewhere cheaper, or rent instead, but that changes what your income buys you. No single annual figure captures that shift. The same story applies to the next-largest purchase most people make, usually a car, and on down the list. That, I think, is the number people mean when they say things feel unaffordable.
Back at the gate
I still do not know whether $52 for two coffees and a bottle of water was unreasonable or simply what a captive market charges. Probably both. But the airport was the least of it. It was the assumption that a single number, 3.4%, calm, declining, nearly normal, was supposed to explain how that receipt felt in my hand.
That is not what it measures. It is measuring the speed of a car whose odometer nobody reads, using a basket that assumes you will eat chicken instead of beef, and treating the roof over your head as a rental estimate. Every one of those choices is defensible. None of them is what “3.4%” sounds like it is telling you.
These are the questions a single figure was never built to answer. What would an honest number look like, not the speed, but the distance, in the goods you actually buy? What would it cost, today, to buy back the life you had ten years ago, rather than the adjusted version of it you have been sold instead? And should a figure built around prices doubling every thirty-five years really be the one we use to reassure ourselves that everything is fine?
I do not have all the answers. But I know this much: it is not just in my head. Inflation at 3.4% is not a lie, and coffee at double is not an illusion. They are two honest measurements of two different things. We have spent years arguing about the economy using only one of them.